First Steps on R
Overview
Teaching: 10 min
Exercises: 10 minQuestions
What is R and why is it important to learn it?
What types of data does the R language has?
Objectives
Understand why R is important.
Describe the purpose and use of each panel in the RStudio IDE
Locate buttons and options in the RStudio IDE
Define a variable
Assign data to a variable
RStudio: First steps of a wonderful journey
It takes courage to sail in uncharted waters -Snoopy
RStudio setup
What is R and what can it be used for?
“R” is used to refer to a programming language and the software that reads and interprets the instructions written on the scripts of this language. It is specialized on statistical computing and graphics. RStudio is the most popular program to write scripts and interact with the R software.
R uses a series of written commands, that is great, believe us! When you rely on clicking, pointing, and remembering where and why to point here or click there, mistakes are prone to occur. Moreover, if you manage to get more data, it is easier to just re-run your script to obtain results. Also, working with scripts makes the steps you follow for your analysis clear and shareable. Here are some of the advantages for working with R:
- R code is reproducible
- R produces high-quality graphics
- R has a large community
- R is interdisciplinary
- R works on data of all colors and sizes
- R is free!
A nautical chart of RStudio
RStudio is an Integrated Development Environment(IDE) which we will use to write code, navigate the files from our computer/cloud, try code, inspect the variables we are going to create, and visualize our plots.
Here is what you may look at the first time you open RStudio:

Figure 1. RStudio interface screenshot. The three windows that appear on the screen provide us with a space in which we can see our console (left side window) where the orders we want to execute are written, observe the generated variables (upper right), and a series of subtabs (lower right): Files shows us files that we have used, Plots shows us graphics that we are generating, Packages shows the packages that we have downloaded, Help it gives us the information of packages, commands and/or functions that we do not know, but works only with internet conection, and Viewer shows a results preview in R markdown files.
If we click in the option File :arrow_right: New File :arrow_right: R Script, we open up a script and
we get what we can call a RStudio nautical chart
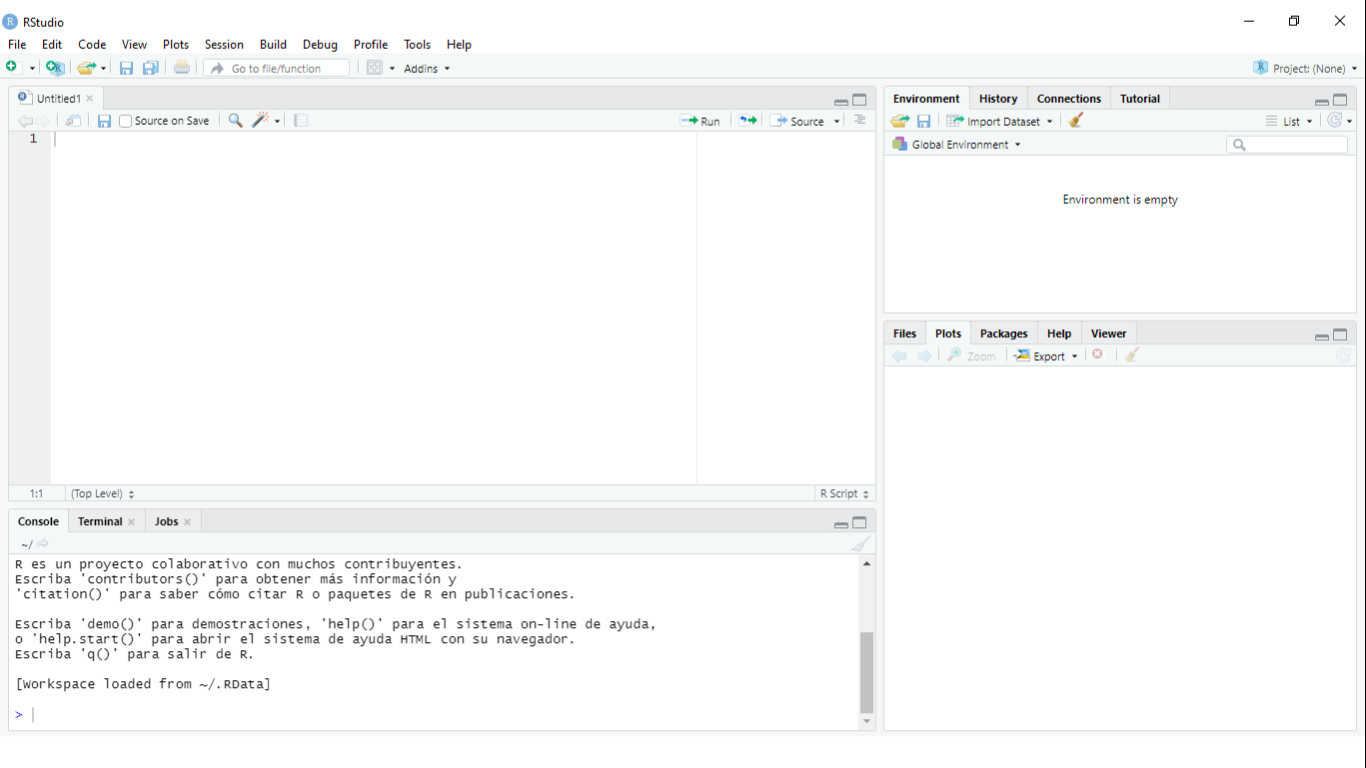
Figure 2. RStudio interface screenshot. Clockwise from top left: Source, Environment/History, Files/Plots/Packages/Help/Viewer, Console.
You can enter your online RStudio to see your own environment. Let’s copy your instance address into your browser
(Chrome or Firefox) and login into Rstudio.
The address should look like: http://ec2-3-235-238-92.compute-1.amazonaws.com:8787/
Although data are already stored in your instance, in case you need to you can donwload them here.
Review of the setup
As we have revisited throughout the lesson, maintaining related data in a single folder
is desirable. In RStudio, this folder is called the working directory. It is where R will be looking
for and saving your files. If you need to check where your working directory is located use getwd().
If your working directory is not what you expected(i.e. ~/dc_workshop/taxonomy/), it can always be changed by clicking on the blue
gear icon:
 on the
 Files tab, and pick the option Set As Working Directory. Alternatively, you can use the setwd() command for changing it.
Let’s use this commands to set our working directoiry where we have stored our files from the previous lessons:
> setwd("~/dc_workshop/taxonomy/")
Having a dialogue with R
There are two main paths to interact with R in RStudio:
- Using the console.
- Creating and editing script files.
The console is where commands can be typed and executed immediately and where the
results from executed commands will be shown (like in the Unix shell). If R is ready to accept commands, the R console shows
the > prompt. You can type instructions directly into the console and press “Enter”, but they will
be forgotten when you close the session.
For example, let’s do some math and save it in R objects. We can store values in variables by
ussing the assignment operator <-:
> 4+3
> addition <- 4+3
> subtraction <- 2+1
> total <- addition -subtraction
> total
What would happend if you tap ctrl + l? Without the lesson page, can you remember what numbers the sum is made of in the variable addition?.
Reproducibility is in our minds when we program (and when we do science). For this purpose,
is convenient to type the commands we want to save in the script editor, and save the script periodically.
We can run our code lines in the script by the shortcut ctrl + Enter
(on Mac, Cmd + Return will work). Thus, the command on the current line, or the instructions
in the currently selected text will be sent to the console and will be executed.
Time can be the enemy or ally of memory. We want to be sure to remember why we wrote the commands
in our scripts, so we can leave comments(lines of no executable text) by beggining a line with #:
# Let's do some math in RStudio. How many times a year do the supermarkets change the bread that they use for
# display?, if they change it every 15 days:
> 365/15
[1] 24.3333
Key Points
R is a programming language
RStudio is useful tool for script writting and data-management.
A variable can temporarily store data.
R datatypes
Overview
Teaching: 10 min
Exercises: 5 minQuestions
What types of data does the R language has?
Objectives
Learn the types of data that we can manage in R.
Types of data
We already used numbers to generate a result. But this is not the only type of data that RStudio
can manage. We can use the command typeof() to corroborate the data type of our object addition:
> typeof(addition)
> [1] "double"
There are five types of data in RStudio:
- Double
- Integer
- Complex
- Logical
- Character
> typeof(5L) #Integer type can contain only whole numbers followed by a capital L
[1] "integer"
> typeof(72+5i)
[1] "complex"
> addition == subtraction
[1] FALSE
> typeof(addition == subtraction)
[1] "logical"
> resultado <- "4 and 3 are not the same in Earth. In Mars maybe... "
> typeof(resultado)
[1] "character"
Also, we can use c() command to enlist a certain number of objects that we want to use. This can
be accomplished by enlisting them inside the parenthesis, and separe each element by a comma. Let’s
create a vector and found out its class:
> v.examp <- c("his ", "scabbard", "of", "chalcedony")
> typeof(v.examp)
[1] "character"
No matter how complicated our analysis can become, all data in R will be allocated as one of this five data types. On their own, data types are important because we want to know “who is who, and what is what”. But this concept will help us learn one of the most powerful tools in R, which is the manipulation of different types of data at the same time in a data-frame.
Key Points
R uses different types of data to store information.
Dataframes manipulation
Overview
Teaching: 10 min
Exercises: 10 minQuestions
Data-frames. What they are and how to manage them?
Objectives
Understand what is a data-frame and manipulate it.
Data-frames: The power of interdisciplinarity
Let’s beggin by creating a mock data set:
> musician <- data.frame(people = c("Medtner", "Radwimps", "Shakira"),
						 pieces = c(722,187,68),
 						 likes = c(0,1,1))
> musician
The content of our new object:
    people pieces likes
1  Medtner    722     0
2 Radwimps    187     1
3  Shakira     68     1
We have just created our first data-frame. We can see if this is true by the class() command:
> class(musician)
[1] "data.frame"
A data-frame is a collection of vectors, a list, whose components must be of the same data type within each vector. Whereas, a data-frame can save vectors of different data types:
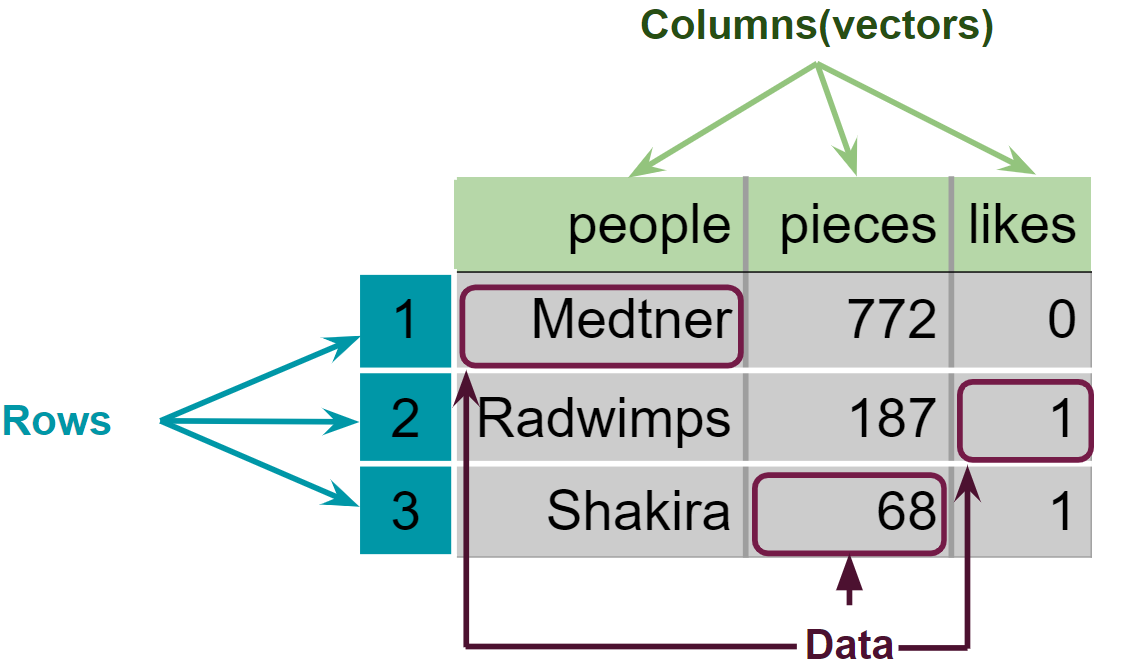
Figure 3. Structure of the created data-frame.
We can begin to explore our new object by pulling out columns by the $ operator. In order to use it,
you need to write the name of your data-frame, followed by the $ operator and the name of the column
you want to extract:
> musician$people
[1] "Medtner" "Radwimps" "Shakira"
We can do operations with our columns
> musician$pieces + 20
[1] 742 207 88
Moreover, we can change the data type of one of the columns. By the next code we can see if the musicians are popular or not:
> typeof(musician$likes)
[1] "double"
> musician$likes <- as.logical(musician$likes)
> paste("Is",musician$people, "popular? :", musician$likes, sep = " ")
[1] "Is Medtner popular? : FALSE" "Is Radwimps popular? : TRUE" "Is Shakira popular? : TRUE"
Finally, we can extract information from a specific place in our data by using the “matrix” nomenclature [-,-],
where the first number inside the brackets specifies the number of row, and the second the number of the column:
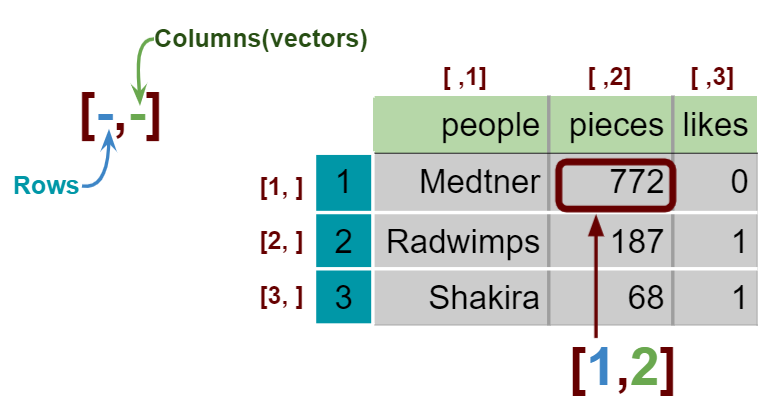
Figure 4. Extaction of specific data in a data-frame and a matrix.
> musician[1,2] # The number of pieces that Nikolai Medtner composed
[1] 722
Key Points
Data-frames contain multiple columns with different types of data.
Finding help on R
Overview
Teaching: 5 min
Exercises: 5 minQuestions
How can I find R help?
Objectives
Use the help command to get more insight on R functions.
Seeking help
If you face some trouble with some function, let’s say summary(), you can always type ?summary()
and a help page will be displayed with useful information for the function use. Furthermore, if you
already know what you want to do, but you do not know which function to use, you can type ??
following your inquiry, for example ??barplot will open a help files in the RStudio’s help
panel in the lower right corner.
With this, we have the needed tools to begin our exploration of diversity with R. That does not mean that we have already covered all that R have to offer, if you want to know more about R, we recomend you to check the R lesson for Reproducible genomic analysis. Let’s continue and see what this journey has to offer.
Key Points
Help
?shows useful information about the functions you inquire.